Conversion Rate Optimization Fundamentals for Service Business Sites
Improving your conversion rate by 3% is mathematically equivalent to doubling your ad spend.

There is a reflex almost every service business owner eventually develops: when leads slow down, spend more on ads. It is understandable. Traffic is visible, trackable, and feels like doing something. Conversion rate optimization, by contrast, sounds like something a startup growth team frets over while the rest of us run actual businesses.
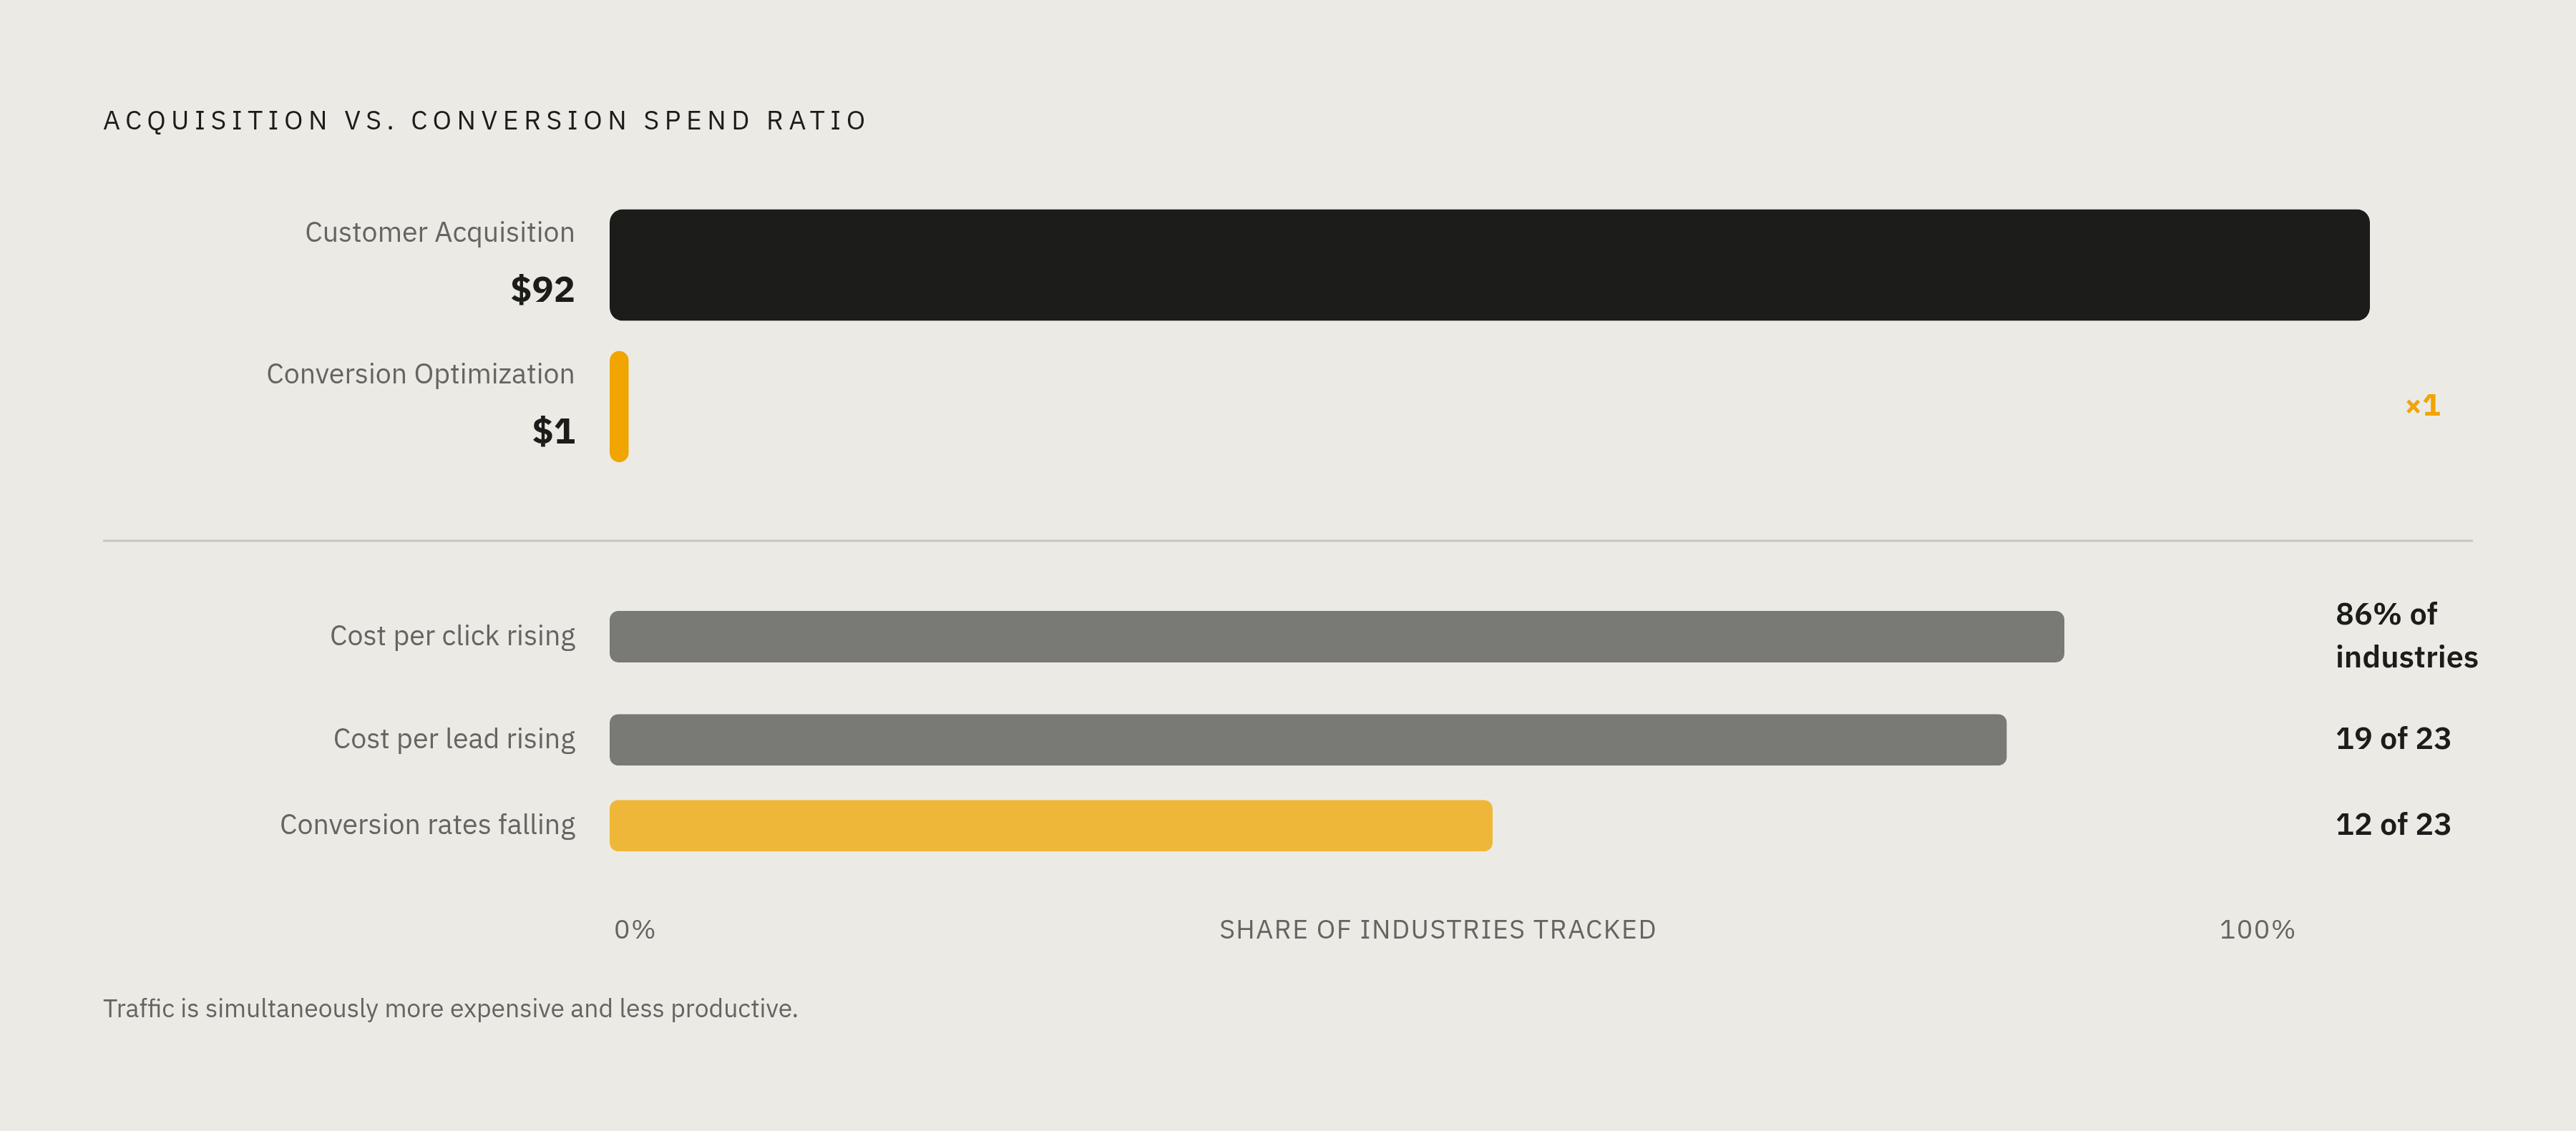
But the math is difficult to ignore. Industry research puts the ratio of customer acquisition spend to conversion spend at roughly 92 to 1. Companies pour resources into getting visitors through the door while spending almost nothing on whether those visitors do anything once they arrive. A site converting at 2% and one converting at 5% can receive identical traffic, run identical ad budgets, and produce fundamentally different revenue. That is not a marginal efficiency gain.
The external conditions have tightened the calculus further. Per the 2024 Google Ads Benchmark, cost per click rose across 86% of industries. Cost per lead increased in 19 of 23 industries tracked. Conversion rates fell in 12 of those same 23. Traffic is simultaneously more expensive and less likely to produce a lead. The instinct to buy more traffic to compensate for underperformance is now operating against a deteriorating baseline.
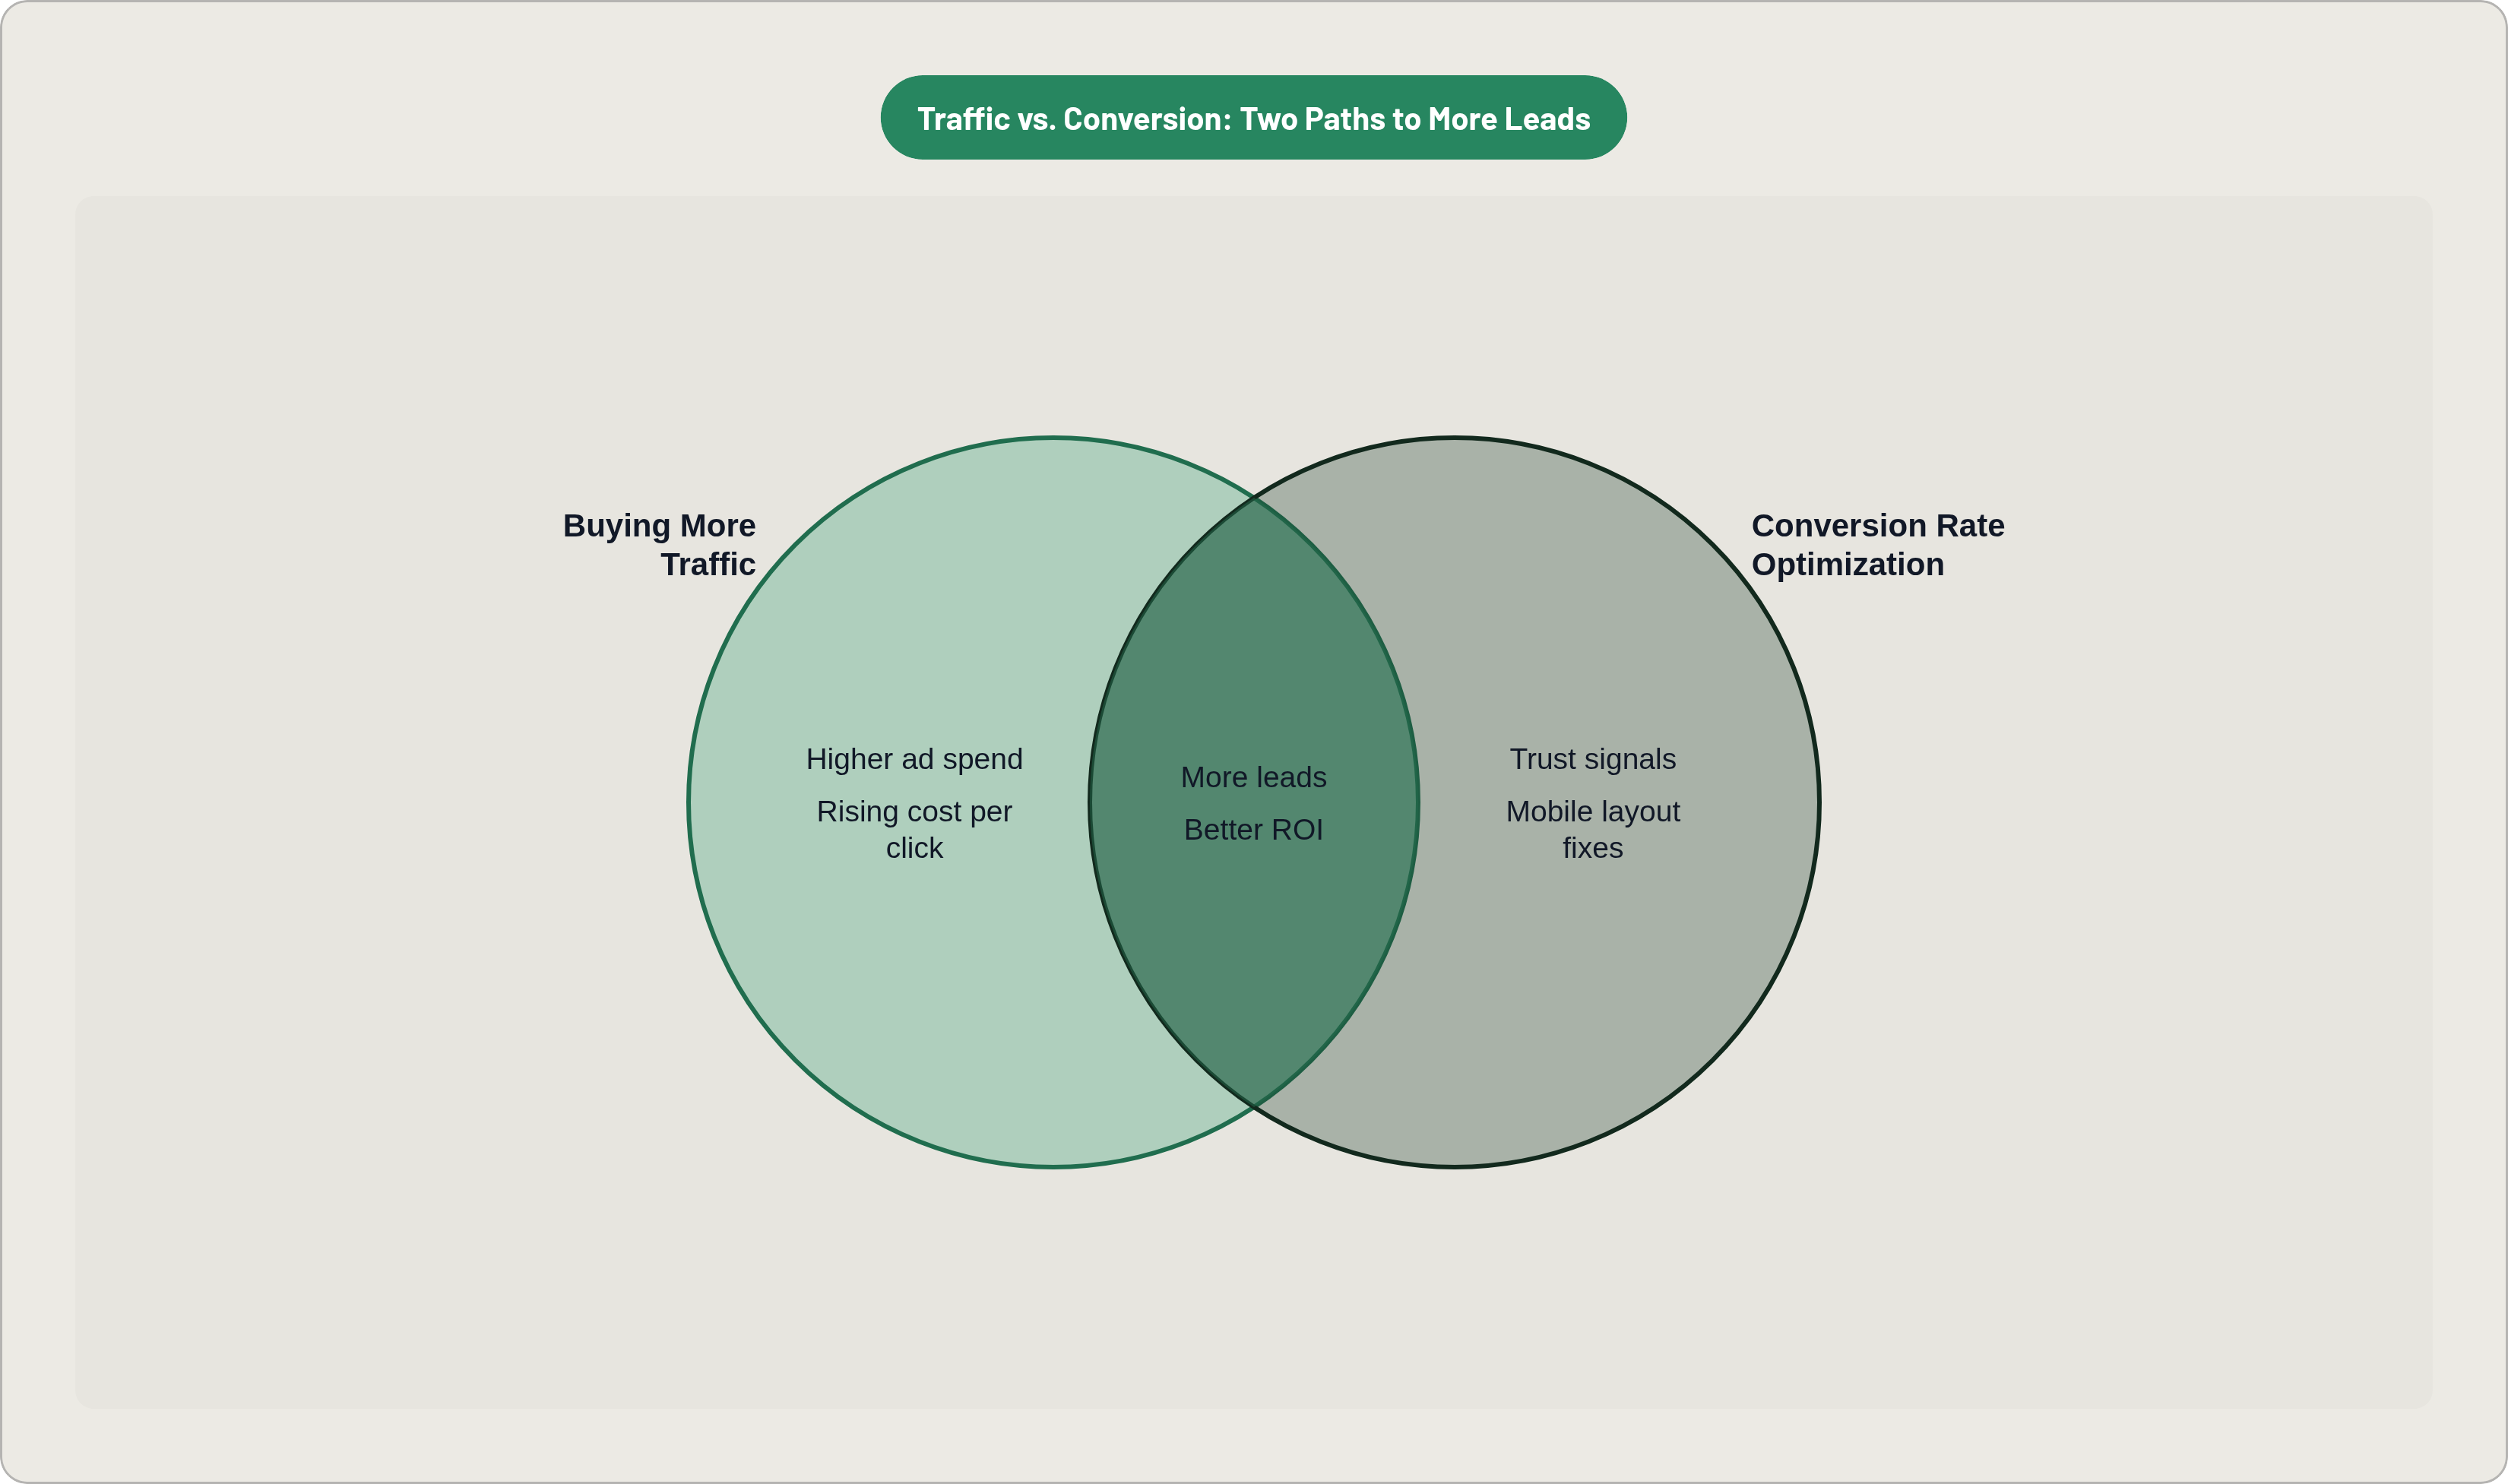
Doubling your conversion rate is arithmetically equivalent to doubling your traffic, at zero additional spend. CRO is a traffic multiplier. Everything that follows is a specific lever for achieving that multiplication, with honest caveats about where the evidence is stronger and where it gets murkier.
For a service site specifically, conversion does not mean a completed purchase. There is no cart, no checkout flow, no abandoned cart email to dispatch at 2 a.m. What a service site has instead is a gap between a visitor arriving and a visitor becoming a lead: a form submitted, a call placed, an appointment booked. CRO is the systematic work of identifying and clearing whatever sits in that gap.
What does friction look like in practice? A page that takes six seconds to load. A phone number that is an image rather than a tappable link. A contact form requiring twelve fields before it will accept a submission. No reviews, no credentials, nothing to answer the quiet question every first-time visitor is running in the background: can I actually trust these people with my problem?
Every page a visitor lands on is a potential conversion point. There is no discrete product page to isolate. And because visitors cannot trial the service before committing, trust-building carries disproportionate weight. The website is often the only evidence a visitor has before they decide whether to reach out.
The conversion events worth measuring narrow to a short list: phone calls, form submissions, booking completions, chat initiations. Micro conversions like scroll depth and time-on-page are useful only as diagnostic signals when macro conversions are already low and you are trying to locate the source of the problem.
Where Most Service Sites Actually Land and What Top Performers Achieve
The widely cited industry average of 2 to 3% conversion rate is nearly useless as a benchmark. It collapses industries, traffic sources, and conversion event types into a single figure that applies precisely to no one. I have seen service businesses celebrate being "above average" at 3.5% while leaving enormous volume on the table because their specific category and traffic mix made 7% achievable.
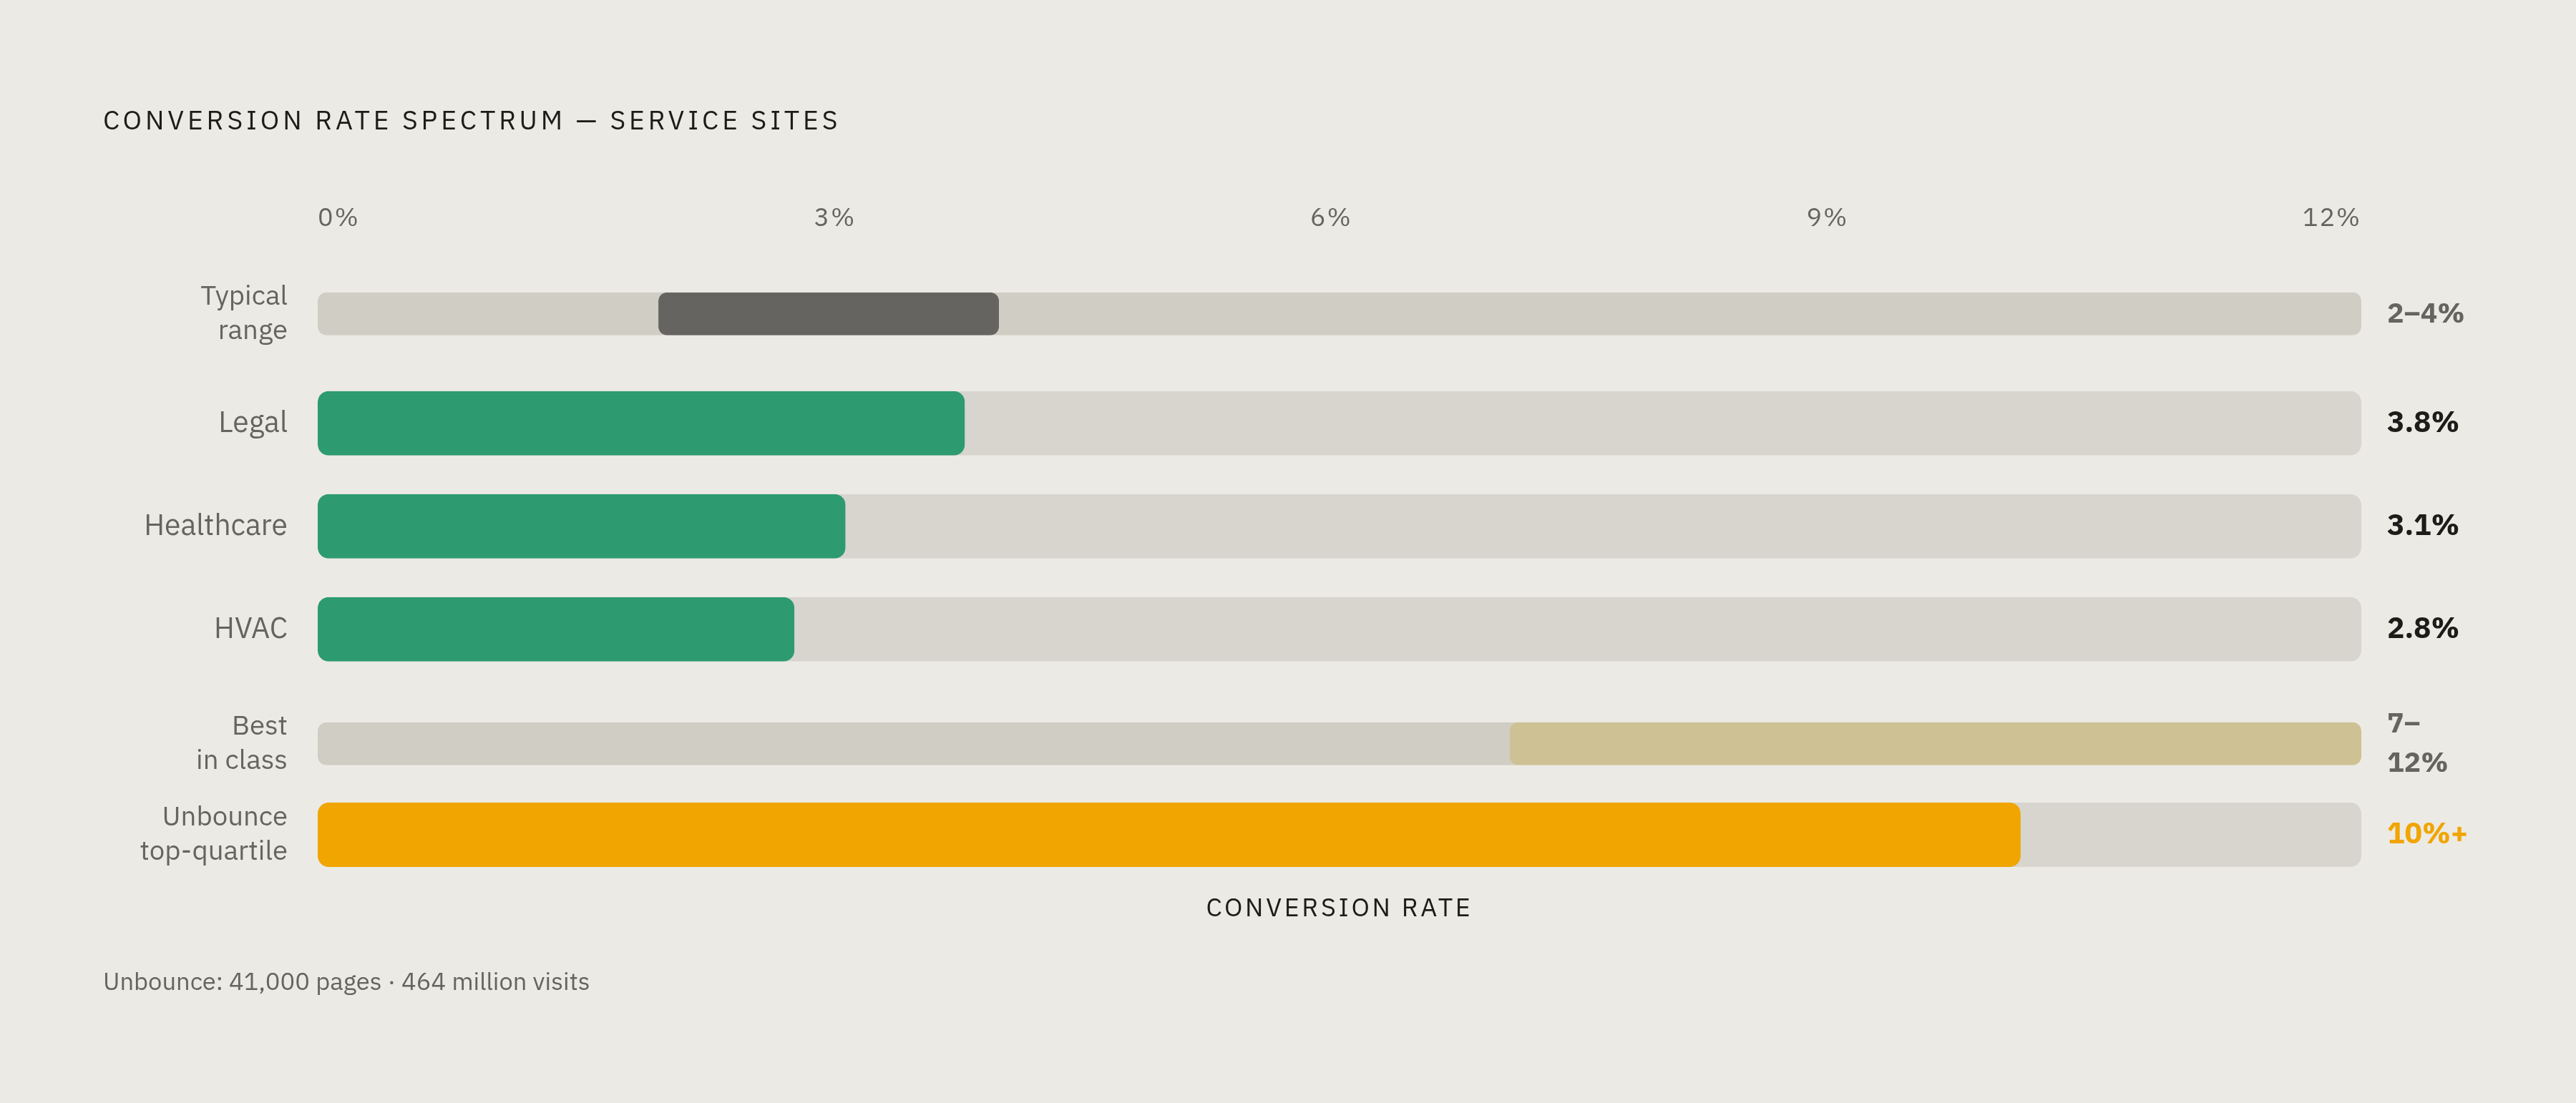
More useful is understanding what top-quartile performance looks like for your specific combination of industry, traffic source, and conversion event. The average service site converts somewhere in the 2 to 4% range. Best-in-class service sites reach 7 to 12%. Unbounce's analysis of over 41,000 pages and 464 million visits puts the median landing page conversion rate at approximately 6.6%, with the top quartile exceeding 10%.
Vertical-specific data from First Page Sage adds useful texture. Legal services sites average around 3.8%. Healthcare lands near 3.1%. HVAC comes in around 2.8%. These are not aspirational targets. They are baselines for contextualization. If your HVAC site is converting at 1.2%, you are not behind the industry average by a little; you are operating at roughly half the rate of a typical competitor.
These figures shift substantially based on whether traffic is paid or organic, and whether visitors are landing on a dedicated campaign page or a general service page. The same business can show wildly different conversion rates across different entry points. A paid traffic landing page with a stripped navigation and a single call to action will almost always outperform the general homepage receiving that same visitor.
The difference between 2 to 4% and 7 to 12% at identical traffic levels is the difference between a marketing channel that barely justifies its budget and one that compounds. That gap is almost entirely explained by what happens on the site after the click.
Why So Many Service Sites Underperform Despite Looking Professional
Here is a tension I have watched play out repeatedly: the service site a business owner is most proud of is often the one that converts least effectively. It has a sleek header image, a well-written "About Us" section, a clean layout. It represents the business well. It just does not convert the visitor.
A site built to represent a business explains what the company does, showcases the team, and puts "Contact" in the navigation. A site built to convert a visitor makes the conversion action unavoidable on every page the visitor lands on. These are different design philosophies. Only 39.6% of businesses have a documented CRO strategy in writing, which means the vast majority are making design choices, not conversion decisions.
The mental model most owners use when building a site is logical: put information where it belongs. Contact information goes on the Contact page. Reviews go on the Testimonials page. This is architecturally sensible and conversion-rate disastrous. Visitors do not navigate like someone exploring a well-organized office. They land, scan, hesitate, and leave.
Roughly 45 to 50% of visits are single-page sessions. Nearly half of all visitors will never see a second page. A contact form buried on a dedicated Contact page is invisible to half the people who ever arrive on the site.
Per Zuko data, only 45% of people who reach a form page actually complete it. Even among visitors motivated enough to find the form and begin filling it out, more than half do not finish. The barrier is not persuasion. It is friction at the moment of readiness, which is the worst possible moment to create it.
Page Speed as a Conversion Lever, Not Just a Technical Metric
Sites loading in one second achieve conversion rates roughly three times higher than sites taking five seconds. Each additional second of load time reduces conversions by somewhere between 7 and 12% on average. And 53% of mobile visitors abandon a page that takes more than three seconds to render, which means a slow site on mobile is losing the majority of its visitors before they have read a single word.
Google completed its transition to mobile-first indexing on July 5, 2024. Every site is now crawled exclusively by the mobile Googlebot. A speed problem does not just suppress conversions; it simultaneously suppresses organic visibility. Core Web Vitals, specifically Largest Contentful Paint, Interaction to Next Paint, and Cumulative Layout Shift, are the measurable proxies Google uses to evaluate page experience. They are free to audit via Google Search Console or PageSpeed Insights, and the results are immediately actionable.
A faster site converts better, ranks better, and reduces paid traffic waste simultaneously. The common culprits on service sites are image compression, render-blocking scripts, slow server response times, and third-party tag bloat from analytics, chat widgets, and ad pixels accumulating over months or years without being cleared out.
Landing pages loading under three seconds show a 32% higher conversion rate than slower counterparts. Page speed is a revenue conversation. The technical work is simply the path to having it.
Mobile Layout Decisions That Directly Affect Whether Visitors Can Reach Out
Eighty-three percent of landing page visits in 2025 come from mobile devices. Mobile traffic converts at around 1.8% versus 3.9% on desktop. That gap does not reflect different visitor intent. It reflects design failures.
Mobile users interact with a fundamentally different physical model: one hand, vertical scroll, thumb-driven navigation, often distracted or in motion. A layout designed for a desktop cursor is not merely suboptimal on mobile; it is actively hostile. Buttons too small to tap accurately. Text requiring pinch-zoom to read. Phone numbers rendered as unlinked text. These are not aesthetic shortcomings. They are conversion barriers fixable in an afternoon.
Tap targets should be at least 44 by 44 pixels to prevent mis-taps. A sticky CTA, a call or contact button fixed to the bottom of the screen, improves mobile conversions by roughly 12%. Text must be legible at default zoom. Mobile-first page designs outperform desktop-first designs by around 17%.
Visitors who have a negative mobile experience are 62% less likely to engage with that brand again in the future. Mobile friction does not merely cost the current session. It degrades the probability of future conversions from the same visitor. For a service business where repeat consideration and word-of-mouth matter, that is a liability that grows quietly.
The diagnostic question is simple: can a visitor who arrives on a phone find the phone number, tap it, and initiate a call in under ten seconds without scrolling? If the answer is no, that is a conversion problem that happens to live inside a mobile experience.
How Trust Signals and Reviews Close the Credibility Gap Before a Visitor Decides to Call
The service business conversion moment is structurally different from any transaction involving a returnable product. A visitor evaluating a plumber, a lawyer, a physical therapist, or a home remodeler is making an irreversible commitment of time, money, and in many cases, access to their home or body, without any trial period. The website is the entirety of the evidence. The question every visitor is quietly running is not abstract: can I trust this company with my problem?
Ninety-five percent of consumers read reviews before making a buying decision. Ninety-two percent hesitate when no reviews are present. Absence of social proof is not a neutral condition; it functions as a negative signal. Displaying five or more reviews increases conversions by up to 270% compared to displaying none, and featuring social proof near a CTA lifts conversions by 14%. Google reviews now account for 81% of all online review volume, making a well-maintained Google Business Profile the single highest-leverage trust asset for most local service businesses.
Named testimonials with reviewer location or context carry more weight than anonymous quotes because they are harder to fabricate and easier to mentally verify. Video testimonials outperform written reviews substantially; pages featuring video convert 34% higher on average. Credentials, licenses, and relevant accreditations address the "are they qualified" question directly, which is distinct from the trust question and worth treating separately.
Placement matters as much as presence. Trust signals positioned immediately adjacent to the primary CTA are the ones that do the actual work. Reviews buried in a footer or on a separate testimonials page do not influence the conversion moment because they are not visible when the visitor is deciding.
The FTC's August 2024 rule prohibiting fake and AI-generated reviews, effective October 21, 2024, carries penalties up to $51,744 per violation. Authentic, consistently accumulated reviews are now the only compliant strategy, and the businesses that have been building genuine review volume over time hold a durable, legally defensible asset. The businesses that have been cutting corners hold a liability.
Landing Page and Form Decisions That Determine Whether a Ready Visitor Converts
Paid and organic visitors should be treated differently, and most service sites ignore this distinction entirely. Paid traffic lands on a page because an ad made a specific promise. Message match, the alignment between the ad headline and the landing page headline, is a basic precondition of trust. A visitor who clicked "emergency HVAC repair in Austin" and lands on a generic homepage with a company logo and a full navigation menu is immediately disoriented. Navigation on paid landing pages should be removed. Every link leading away from the conversion action is a conversion leak, and removing navigation alone increases conversions by roughly 15%.
Organic visitors behave differently. They are browsing before committing, they need context, and they need a conversion path that does not require navigating to a separate contact page. The optimization priorities differ, but the underlying logic is the same: every friction point between arrival and action is an opportunity to lose the visitor.
Clear headlines stating what the business does and who it serves outperform clever ones with regularity. Headline tests produce an average 9% lift, which is substantial for a single element changeable in an afternoon.
Per Unbounce's analysis of 57 million conversions, pages written at a 5th to 7th grade reading level convert at 11.1%, which is 56% higher than pages written at an 8th to 9th grade level, and more than double the rate of professional-level copy. The instinct to write at a register that sounds credible or authoritative is actively working against the conversion. Write about the customer's problem in plain language and the numbers improve.
Three-field forms produce the highest completion rates, and each additional required field reduces completions. Reducing form fields at Kareo increased new physician sign-ups by 30%, translating to $1.56 million in annual revenue and a 40% improvement in marketing ROI. When more information is necessary, multi-step forms consistently outperform long single-page forms because commitment builds progressively rather than presenting the full ask upfront.
Personalized or outcome-specific CTA copy converts 42% higher than generic alternatives. "Get a free estimate for your roof" outperforms "Contact us" not because it is longer but because it is specific. The visitor knows exactly what they are getting.
How to Identify Which Friction to Fix First When Resources Are Limited
Per Speero's 2025 Experimentation Maturity Program Report, 58% of companies lack a clear prioritization framework for CRO. The result is optimization that feels productive but is not sequenced correctly: headline tests running on a page with a four-second load time; CTA copy being refined while the form has twelve required fields.
A sensible prioritization follows a simple logic. Start with the highest-traffic entry pages, because a 1% improvement there outperforms a 10% improvement on a page almost no one sees. Fix technical barriers before testing copy, because a slow page or broken mobile layout is a ceiling on every other improvement made above it. Audit the conversion path with one specific question: can a visitor on any device complete the primary action without navigating away from the page they landed on? If not, fix that before anything else. Add trust signals nearest to the CTA before testing CTA copy, because trust problems and copy problems are distinct and easily conflated.
Before testing anything, measure three things. Current conversion rate per entry page, broken out by traffic source and device type, tells you where the problem lives. Form abandonment rate tells you whether visitors are finding the form and not completing it, a different problem than not finding the form at all. Page speed scores via Core Web Vitals, freely available through Google Search Console and PageSpeed Insights, reflect both conversion and organic search implications simultaneously.
A/B testing is a tool for incremental optimization once structural problems are resolved. It is not the starting point. For most small service businesses, fixing the obvious friction points, speed, mobile layout, form length, and missing trust signals, will produce more total lift than any testing program applied to a fundamentally broken experience.
Meaningful A/B test results require sufficient traffic. Roughly 1,000 or more conversions per month is a commonly cited threshold for statistical validity. Below that volume, qualitative methods, session recordings, heatmaps, and direct user feedback, produce faster and more reliable insight. Testing your way to a conclusion when you have 80 monthly conversions is not optimization; it is a way of feeling like you are doing optimization.
For most service businesses, CRO is not a sophisticated discipline requiring specialized tooling and a dedicated growth team. It is the less exciting work of ensuring that the visitors you are already paying to acquire can actually contact you once they arrive. The traffic problem and the conversion problem get conflated constantly. They are not the same problem, and only one of them compounds against you every year regardless of what you do.